See for yourself how Quartix works with our fully interactive real-time demo.
Road speed database
Quartix captures more than 30 million vehicle movement events every day. With this data, we are able to maintain our Road Speed Database for the UK roads network, This database allows us to compare the speed profile of individual drivers to other drivers on the same section of road, by providing two key pieces of information: an estimate of the speed limit for the location of the vehicle and a distribution of measured speeds at that point.
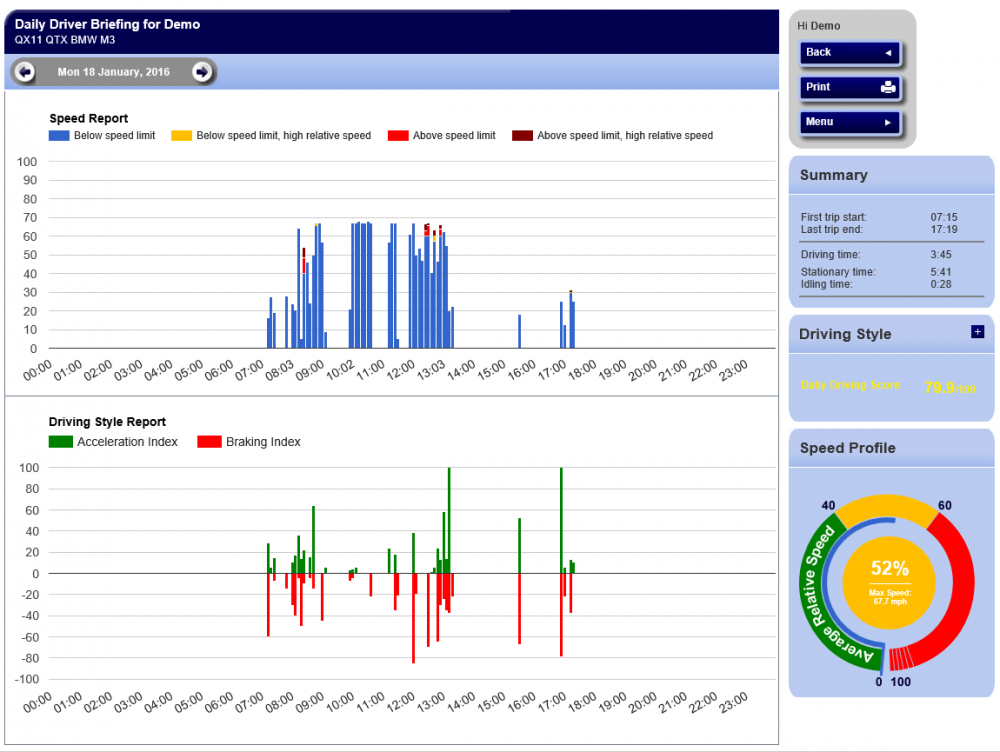
Within the new Daily Driver Briefing report, the driver’s speed profile, or Speed Report, for the day is shown in the top chart. The Driving Style Report graph below that shows a comparison with the Road Speed Database profile for that section of road and shows the driver’s Acceleration and Braking Indexes. The Speed Profile dial displays the driver’s overall average speed distribution percentile.


Speed reports
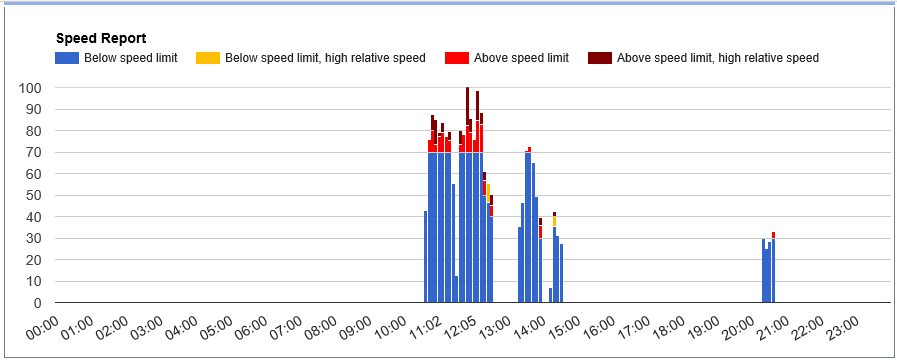
For the times that the driver has stayed below the speed limit for that part of the road, the bar will be blue. When they stayed below the speed limit, but their speed was higher than 95% of other drivers on that same road, the bar will be yellow. This indicates that although they were not legally speeding, they were driving faster than what is normal for that road.
The minutes when the driver went above the speed limit will show as bright red. For the times the driver was above the speed limit and drove faster than 95% of other drivers who were also above the speed limit, the bar will be dark red. This indicates that not only were they speeding, but they were speeding in excess of other drivers.
Speed profile
The Speed Profile dial is a brand new feature on this report. It shows the driver’s speed relative to other drivers as a percentile, which is averaged over the trips taken on that day. Most drivers will fall between 40% and 60%. In the below example, however, the driver’s average speed profile is significantly higher than most other drivers.
Quartix’s enhanced Daily Driver Briefing gives you an even more accurate portrait of how your drivers are taking to the roads. With this information, you can adopt policies and practises that can lower your fuel costs, decrease your environmental impact and improve the overall safety of your fleet.


