See for yourself how Quartix works with our fully interactive real-time demo.
Real-time monitoring of your fleet
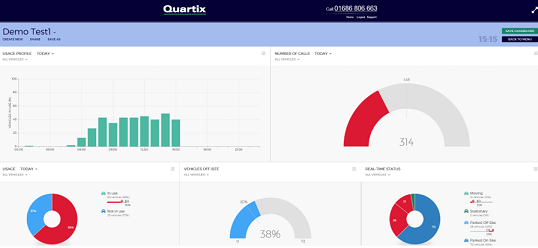
It’s always been possible to customise the Quartix system, to allow each customer to tailor our reporting tools to best suit the needs of their company. With the addition of the new Quartix Dashboards, we have gone one step further towards giving our customers control over how they view their fleet’s activities in real-time.
The Quartix Dashboards are made up of a number of components, each using simple and clear graphs to display a variety of live fleet information. Individually, each one is itself customisable.
Dashboard components
You can view the components on the Live Status Dashboard, with two at the top and three below. This live dashboard will routinely update to show the current status of all parameters being monitored—you can choose to view your entire fleet or specific groups of vehicles for each individual component.
Once you have created a layout for the dashboards that best suits your needs, you can save this under a customised name, to use in the future. You can also choose to share the dashboard with another user on your account; when you make changes to the individual components, or delete/add a component, this will be reflected on everyone’s setup for that dashboard. There is no limit to the number of dashboard set-ups you can have on your account and more components will be made available as they are developed.
The components currently available are as follows:
Usage profile
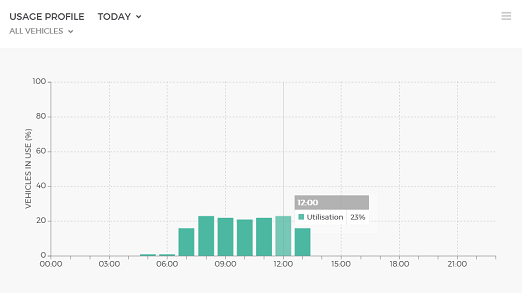
This component, displayed as a bar chart, shows the percentage of vehicles in use either for each hour of the current day or for each day of the week. Clicking on any bar in the chart will list the vehicles in use and not in use during that time period, in separate, scrollable lists. You can then click on a vehicle to view its daily log (for vehicles in use) or last location (for unused vehicles).
Usage
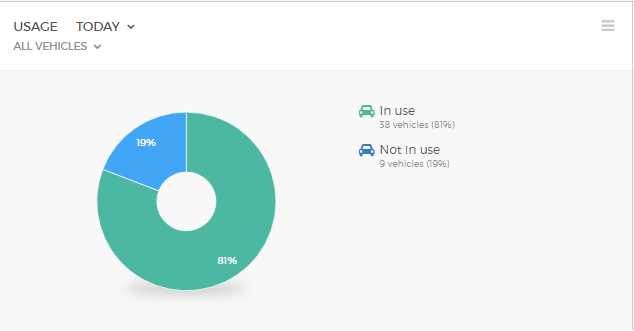
This doughnut chart shows the vehicles that are used and unused for either the day or the week as whole, rather than by the hour as in the Usage Profile. A vehicle will be considered ‘used’ if it has made a trip that exceeds 250 metres, although this is customisable via the admin window and can be defined by an ignition-on event. For this component, you can set the utilisation target, or the percentage of the fleet that must be in use during the time period. You can also decide when an alert will show if this has not been reached.
For example, if it is a requirement that over 60% of the fleet be used during the day, it would be irrelevant to raise an alert that this hasn’t happened at 08:00, if most of the vehicles were naturally not in use up until then. Therefore, it is possible to set the time by which this criteria should be met. Alerts for all components will show as red on the graphs.
For a weekly chart, the alert condition will be based on the daily average for the week so far.
Clicking on any section will list the vehicles in use and not in use during that time period, in separate, scrollable lists. You can then click on a vehicle to view its daily log (for vehicles in use) or last location (for unused vehicles).
Number of calls
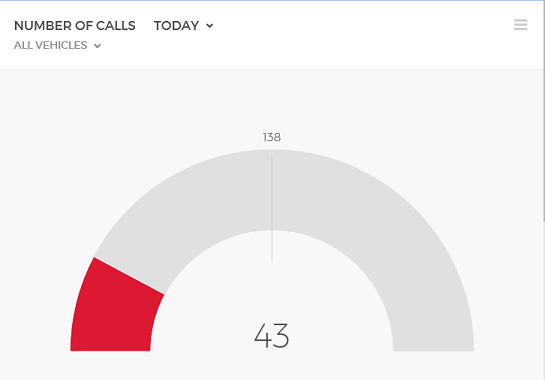
This component, displayed as a speedometer, shows the number of calls made as compared to a set target number. A ‘call’ is considered to be a stop at a different place from where the vehicle was kept at the start of its shift. You can define a target for the number of calls per vehicle, and the total calls will be calculated from that and the number of vehicles in your selected group. The scale on the chart will run from 0 to twice the target level, to account for trips made beyond the target number; the exact target level will show at the top of the arch.
For this component, you can determine the calls per day per vehicle, the alert start time, and whether or not to include stops where the ignition is left on. Clicking on the component will display the list of vehicles, in ascending number of calls undertaken, and each vehicle will take you to its daily log.
Vehicle off-site
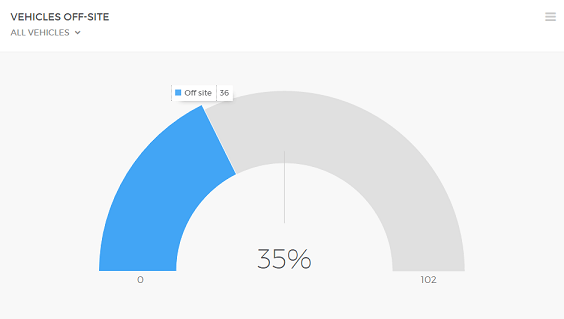
This component, displayed as a speedometer, shows the number of vehicles that are away from their overnight location, to give the measure of fleet activity.
For a vehicle to be considered ‘Off-Site,’ its latest event must be at a different place from where the vehicle was kept overnight. This can be done by comparing the location of the latest event with that of the day’s first Ignition-On event. The scale will be from zero to the number of vehicles in the selected group and the percentage target point is represented as a line on the dial.
Clicking on any section will list the vehicles in use and not in use during that time period, in separate, scrollable lists. You can then click on a vehicle to view its daily log (for vehicles in use) or last location (for unused vehicles).
Real-time status
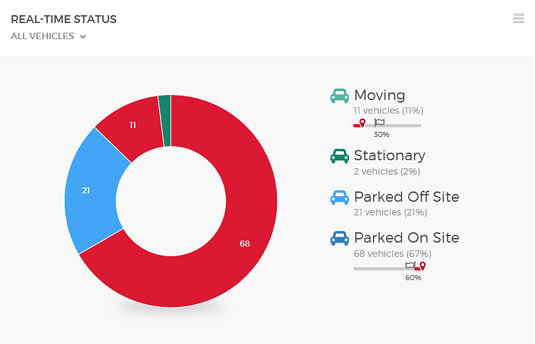
This doughnut chart summarises what all selected fleet vehicles are doing at the current time. The status options are Moving, Stationary, Parked Off-Site, and Parked On-Site. Off-Site will be considered to be a different place from where the vehicle was kept overnight.
You can adjust the target levels for each status option, and whether an alert will be raised for numbers above or below this target. You can also set the alert start and end times. Clicking the sections will show a list of the vehicles in each category, sorted in descending order of importance. In other words, if the target is to be above a certain number, the furthest from meeting that criteria will be shown first. You can click through the daily log for each vehicle.
Check your targets
Some of the components have additional graphics, such as above, that flag the targets for each status and alert in red, just like the graph itself, until those targets are met. A glance at the screen can tell you how close you are to reaching a particular target.
These five components offer quick and comprehensive views of the most vital functions of a mobile fleet and make staying on top of operations easier than ever.

