

See for yourself how Quartix works with our fully interactive real-time demo.
Quartix is trusted by over 30,000 fleets (and counting). It’s known for delivering core vehicle tracking tools—like live location updates, route histories, and driving metrics—while offering flexible contracts that won’t lock you in for ages with award winning customer service! We’re the number 1 vehicle tracking solution on Trustpilot!
Yet, if you’re wondering whether Quartix is the right fit for your fleet, you’ll want a deeper look at everything from its layout and key features to its pricing plans and support channels. Below, we’ll walk you through the essentials, highlight the pros and cons, and show you how Quartix stands on its own as a back-to-basics approach to fleet management.
Table of Contents
- Interface Layout and Navigation
- Core Features
- Customer Support
- Pricing & Plans
- Verdict: Is Quartix Right For Your Fleet?
Interface Layout and Core Navigation
When you log in, you’re greeted by our company logo set against a clean, minimalist landing page. At the very bottom, you’ll notice a small section with our support phone number and email address—help is always within reach.
Our design embraces modern aesthetics, featuring a deep green colour scheme that reinforces our brand identity. The interface showcases sleek curves and contemporary sans serif typography, making for a visually appealing and intuitive experience. On the left-hand side, you’ll find a persistent navigation bar that organises the software into four main categories: Live Tracking, Route Map, Tracking Log, and Fleet Management.
Once you select a category, a box pops up that lets you refine what information you want to view. For example, in the Live Tracking section, you can choose specific data points that are most relevant to your day-to-day operations. In addition, a gear icon in the bottom left-hand corner gives you instant access to configuration settings. Here, you can update your profile, find help resources, and adjust advanced settings—including custom locations, geofences, inspection templates, and scheduled reports. This setup means that every time you log in, you have a tailored view that puts you in control from the very first click.
For those who prefer a more traditional interface, our platform also offers a “Classic” view. This alternative layout presents a straightforward, text-based design with clear-cut edges and extensive dropdown options. Whether you’re a longtime user or new to the system, you can select the layout that best suits your workflow.
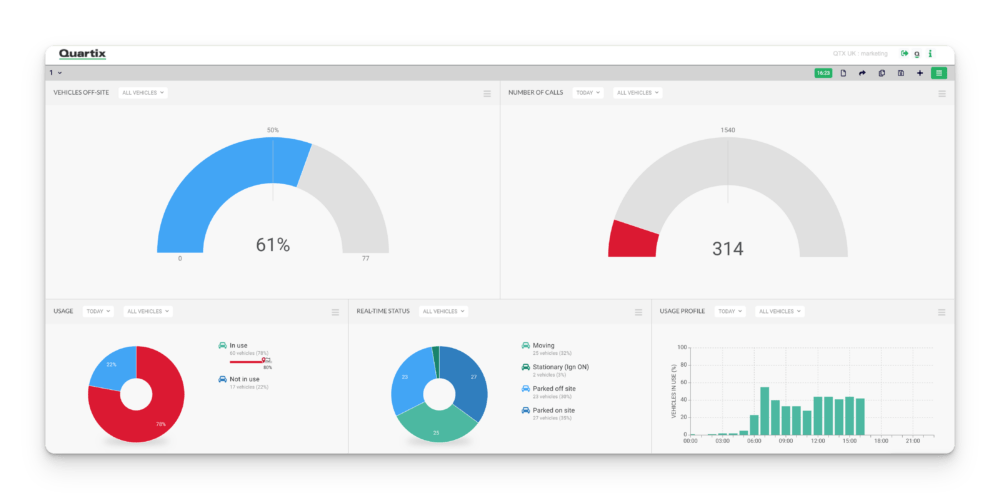
Customisable Dashboard for At-a-Glance Insights
One key feature is the Dashboard, which provides a fully customisable workspace for monitoring key fleet data at a glance.
The Fleet Management Dashboard allows you to build a personalised view by selecting custom components, resizing and rearranging them, and filtering data based on vehicle usage. Each component offers real-time insights tailored to your operational needs.
Key dashboard components include:
- Usage Profile – Overview of vehicle activity, including mileage and time on the road.
- Real-Time Statuses – Live updates on fleet movement, including which vehicles are in operation.
- Usage Metrics – Breakdown of fleet performance and activity patterns.
- Vehicles Off-Site – Quick visibility on which vehicles are not currently at their designated locations.
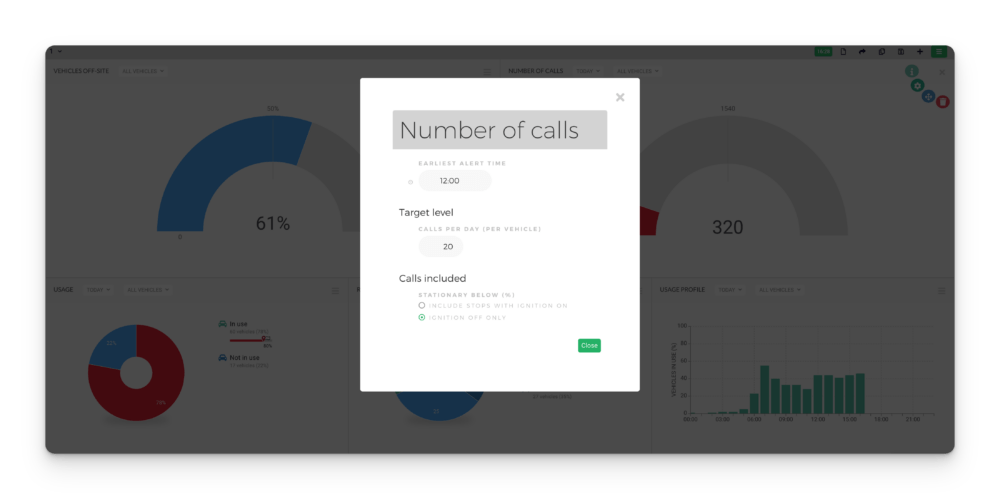
- Number of Calls – A metric representing ignition cycles, which can be configured to include stops with ignition on or focus solely on ignition-off events.
Each dashboard component can be customised further by setting specific targets and adjusting display parameters. For example, in the Number of Calls component, users can define different thresholds, such as stationary percentage or ignition status, to refine the data displayed.
Users can also edit their dashboards by adding, removing, or rearranging components to match their specific monitoring needs. Configuration options allow for filtering by vehicle groups, setting performance benchmarks, and adjusting the display format to highlight key operational insights.
By leveraging the dashboard feature, fleet managers can streamline data monitoring, making it easier to track vehicle performance and identify areas for optimisation—all within a fully customisable interface.
Core Features
In this section, you’ll explore the tools and functions available in the interface. For this demonstration, we’re focusing on the features provided in the Info Plus plan, all designed to work together for a complete tracking solution.
Map Interface: Intuitive Icons and Graphics
In the Live Tracking section, you’ll see a split-screen display that combines a detailed table with a dynamic map. The table lists key information for every vehicle—registration numbers, descriptions, status icons, and the latest known location. Adjacent to this, the map shows real-time updates using intuitive icons to indicate the direction and movement of your fleet.
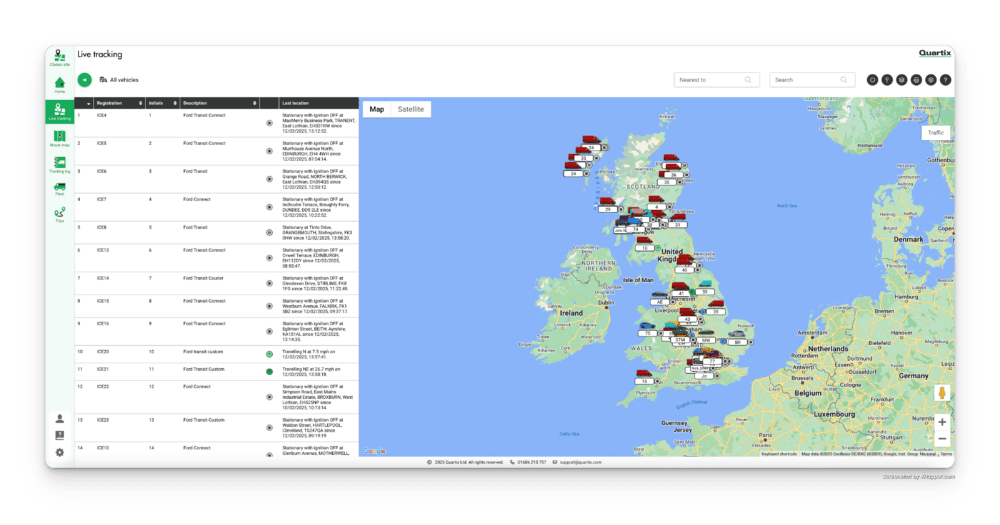
One standout feature is our colour-coded system, which instantly communicates the speed of each vehicle:
- Black square: Indicates the vehicle is stopped and the ignition is off.
- Pause symbol: Shows that the vehicle is stationary with the ignition on.
- Green arrow: Denotes a speed lower than 30 mph.
- Yellow arrow: Represents speeds between 30–50 mph.
- Blue arrow: Signals speeds between 50–60 mph.
- Orange arrow: Indicates speeds between 60–70 mph.
- Red arrow: Warns that the vehicle is traveling at speeds above 70 mph.
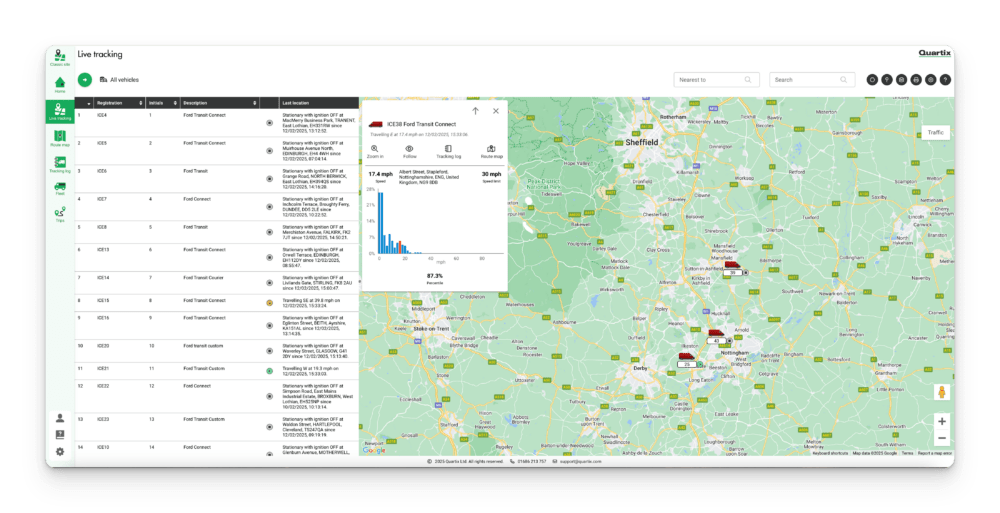
Each vehicle is displayed with a unique icon—whether it’s a compact car, a van, or a heavy truck—so you can instantly identify the type of vehicle in any location. When you click on a vehicle in the table, the map centres on that specific vehicle, and you’re presented with a popup that details its speed, direction, and the time of its last update. Additionally, below these details, you’ll find a graph that displays the range of speeds recorded on the current trip, with the current speed highlighted prominently. This extra layer of visual data helps you quickly assess driver behaviour without having to dig into separate trip reports.
Customise the Map View to Your Liking
At the top right-hand corner of the map view, you have full control over how the data is displayed. With just a click, you can toggle several overlays on or off:
- Live Traffic Data: See real-time traffic conditions to help you plan routes more effectively.
- Geofences: Display custom boundaries for your vehicles, making it easy to monitor when they enter or exit specific areas.
- Custom Locations: Add frequently visited spots or important addresses.
- Custom Map Overlays: Integrate your own data layers via your Google account for an even more personalised view.
You also have the option to remove the data table from view or move it to the top of the page. This flexibility ensures that whether you’re in the office or on the go, the interface adapts to how you work best.
Route Map: Easily Tracked Driving Histories
Access the Route Map from the left-hand sidebar. Here, you select whether you want to review data by vehicle or driver, choose a specific custom group if desired, and set start and end dates to replay historical routes.
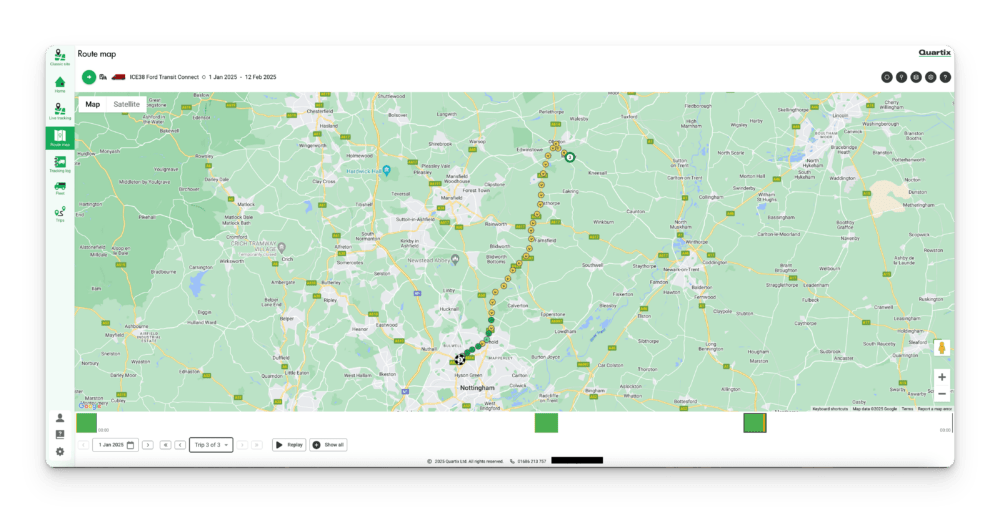
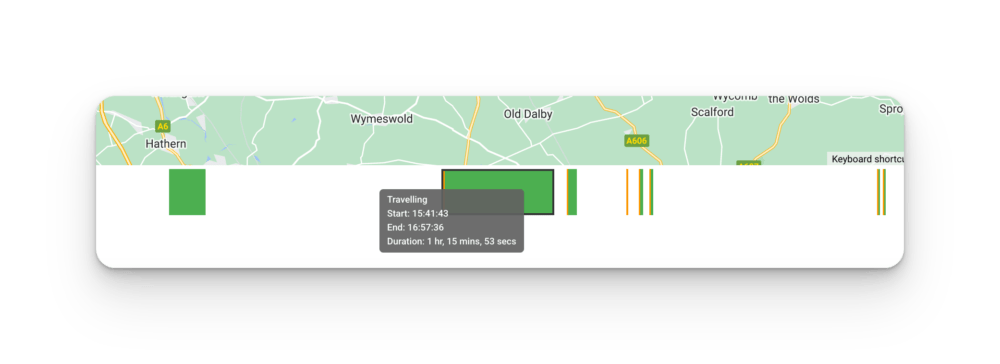
Once you confirm your selection, you’ll see all routes taken during that period, neatly broken down into individual trips. The first trip is displayed on the map using the same colour-coded arrow system as in Live Tracking. Below the map, a timeline bar shows the vehicle’s route history, with green indicating movement and orange indicating periods when the vehicle was stationary with the ignition on. Clicking any section of the timeline brings up that specific route for closer inspection.
You can view all trips for the chosen period simultaneously or replay a route in real time—with adjustable speed settings—and even enable speeding violation indicators for additional insights.
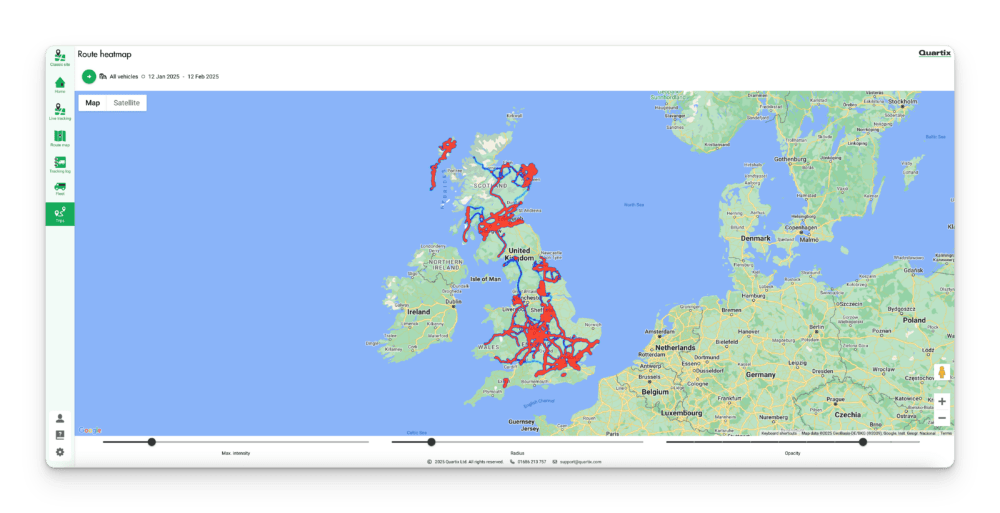
Heat Map: Visualising High-Activity Areas
The Heat Map allows you to visualise your fleet’s most frequently traveled routes over a selected period, helping you quickly identify high-traffic areas, inefficiencies, or opportunities for route optimisation through informed route allocation preventing cross over, reducing associated fuel costs.
To access the Heat Map, navigate to the Trips section from the left-hand sidebar and select Route Heatmap. From here, choose the vehicle(s) you want to analyse and set a date range, keeping in mind that the system can generate data for up to one month at a time.
Once generated, the map will highlight the most commonly used routes, with colour intensity indicating activity levels—darker or more concentrated areas represent higher travel frequency. This makes it easy to spot patterns in driver behaviour, identify potential bottlenecks, and assess route efficiency.
The Heat Map is particularly useful for fleet managers looking to optimise travel routes, reduce unnecessary mileage, and improve overall operational efficiency. By analysing historical driving patterns, you can make data-driven decisions to enhance productivity and reduce costs.
Tracking Log: Simple Driver Trip Tables
The Tracking Log works similarly to the Route Map. Simply choose whether to view data for a vehicle or driver, select the specific subject, and define your desired date range. You’ll then see a clear table summarising travel details for each day, or you can click the “Trip Summary” button for a breakdown of individual trips.
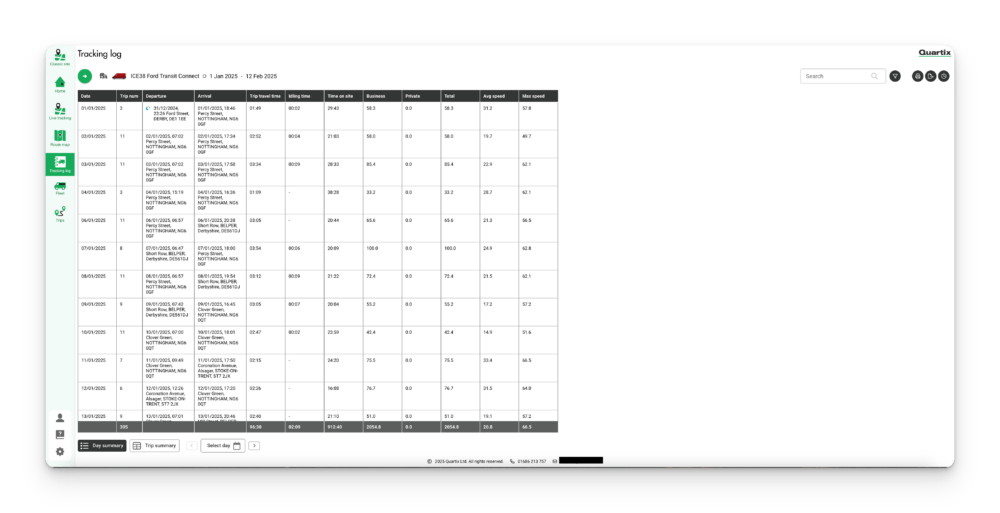
This table provides key information such as travel time, time on site, idling periods, and both average and maximum speeds. Icons let you jump directly to a route view for any particular trip, making it easy to review details quickly.
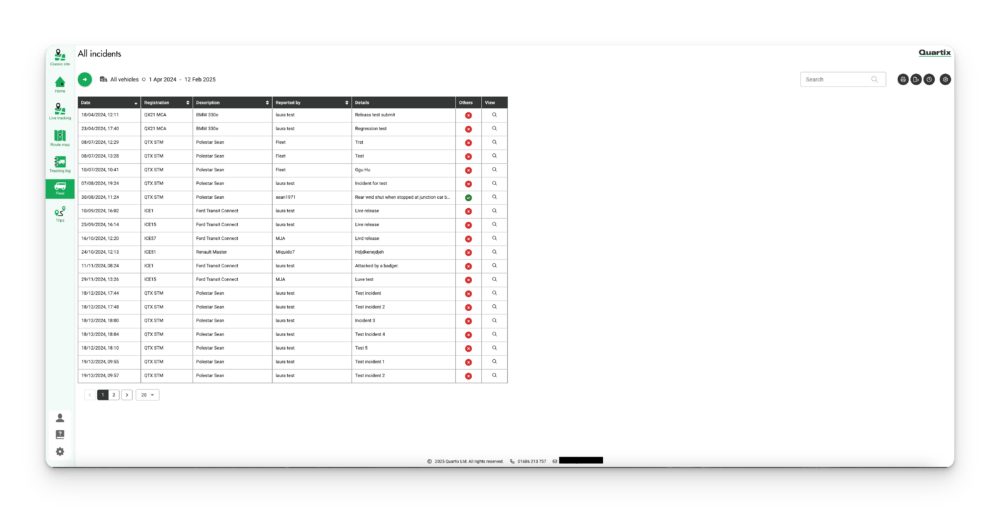
Fleet Tools: Handy Incident and Inspection Records
Within the Fleet section, you can manage records related to incidents and inspections. For incidents, a table displays the date, vehicle registration or name, incident details, the reporter’s information, and any other involved parties—filtered by your chosen vehicles, drivers, or time frame.
This feature is powered by the Quartix Check vehicle inspection app, which not only helps fleet managers keep track of incidents and inspections but also allows drivers to report accidents and issues directly from the field—ensuring a streamlined and efficient process for maintaining fleet safety.
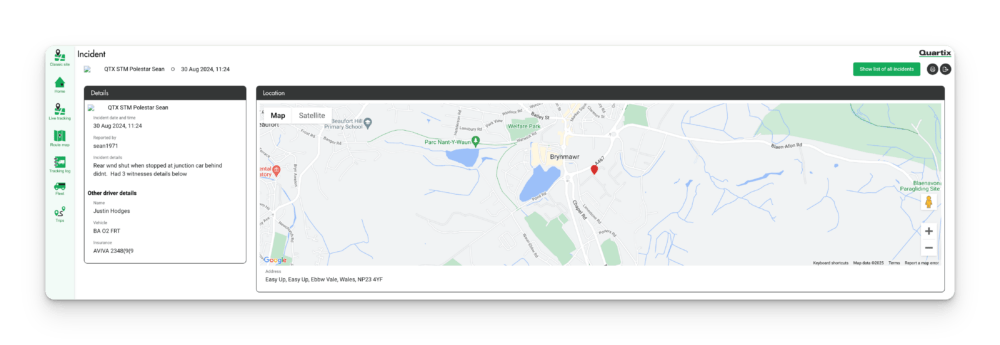
Clicking the “View” icon next to an incident opens a detailed report that includes a map and any attached photographs, so you can review what happened at a glance. The inspections tool follows a similar layout, making it straightforward to keep track of all necessary maintenance or compliance checks.
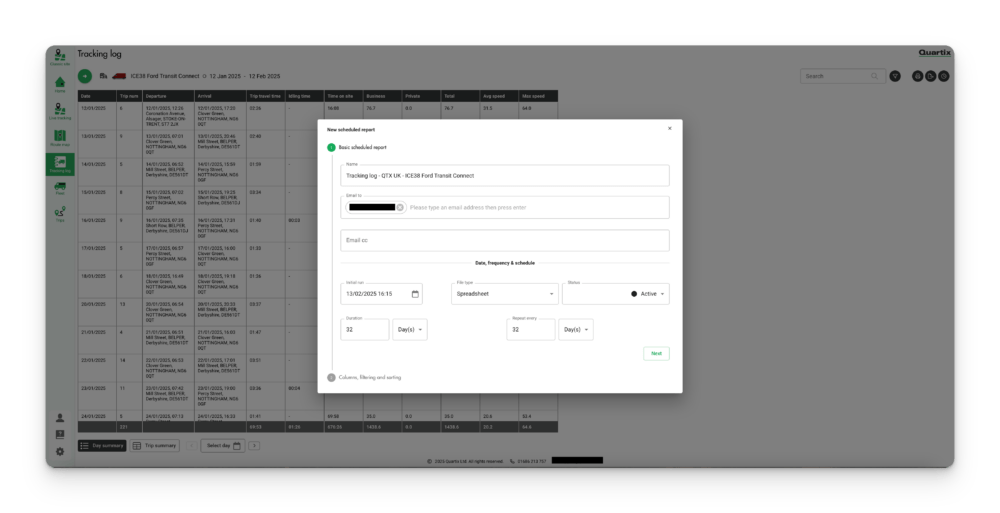
Scheduling Reports
You can schedule automated reports for the Tracking Log, incidents, and inspections. Choose your preferred frequency, format, and the specific data you need—such as details for particular vehicles or drivers—and the report will be sent directly to your email. For example, you might set up a report to run weekly, covering data from the past five days.
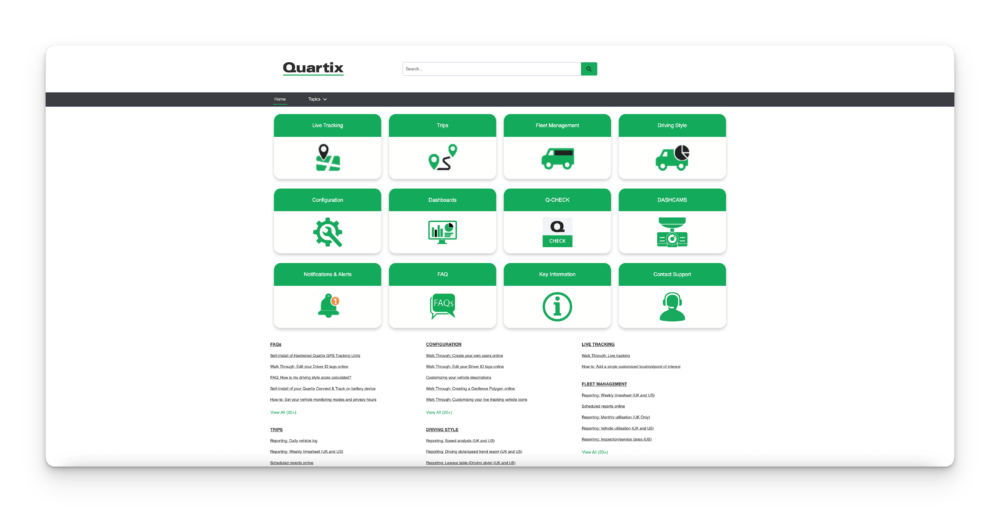
Customer Support
We’re committed to supporting you when you need help. Our dedicated UK support team is available via phone and email from 8:30 am to 5:00 pm, Monday to Friday. Additionally, our extensive online knowledge centre is filled with articles on topics such as monitoring vehicle usage and accessing dashcam footage, ensuring you have the resources to solve common issues quickly.
Pricing & Plans
We offer a range of plans designed to suit different fleet tracking needs—from basic to fully comprehensive solutions. Our pricing is customised based on the size of your fleet, the features you require, and your contract terms. For reference, please see the table below which outlines the features and previous price points for each plan:
| Plan | Features |
|---|---|
| Info Point | Basic live tracking with 2‑min updates, daily logs, 12‑month history, unlimited user accounts, and mobile app access |
| Info Plus (Most Popular) | All Info Point features plus 1‑min updates, driving style reports, geofencing, speed and trip reports, management reports, route maps, and logs |
| Info Fleet | All Info Plus features plus Fleet Management tool integration and fuel card integration |
Both Info Plus and Info Fleet plans offer optional add‑ons such as temperature readings via probes, HD cameras, and fixed driver IDs for multi‑vehicle users.
In this walkthrough, we’ve focused on the Info Plus plan. If you need more advanced integrations—such as fuel management and enhanced compliance tracking—the Info Fleet plan might be the right fit.
Is Quartix Right For Your Fleet?
At Quartix, we offer a cost-effective solution that delivers all the essential tracking, monitoring, and reporting features you need—without unnecessary extras. Our platform is built to run fast and efficiently, giving you instant visibility into your fleet through intuitive icons and detailed map displays. With features like the Route Map, Tracking Log, and Fleet Management tools, you can access granular data on previous trips, helping you make informed decisions every day.
We’ve designed Quartix with small to medium-sized fleets in mind, focusing on doing the basics exceptionally well on flexible, short-term 12‑month contracts. If your operations are streamlined and you value core functionality, our platform is an attractive option. For larger fleets or businesses that require advanced features—such as enhanced reporting, report scheduling, 3rd part integrations, and much more—you might need additional tools to support those extra layers of complexity (always delivered in an easy to use solution). We understand that every business has unique needs, and we’re continuously evolving to help you find the right balance.
Ultimately, your choice comes down to finding the perfect fit for your operational requirements and budget. Quartix stands out as one of the more affordable and efficient fleet tracking solutions on the market.
Ready for a Live Demo?
We hope this walkthrough has given you a good look at our key features. There’s nothing like seeing our platform in action, so why not arrange a live demo with us? Experience firsthand how we can help streamline your fleet management—schedule your demo today!
Need to speak to one of our experts?


We’ll help you decide which vehicle tracking option is right for you