

See for yourself how Quartix works with our fully interactive real-time demo.
Managing a fleet can be complex, but understanding a driver’s activity throughout the day just got easier with our new Interactive Timeline feature within the existing Route Replay option. This new addition adds a clear, visual representation of travel, idle, and stop activities over a 24-hour period, making it simple to monitor your vehicle’s movements at a glance.
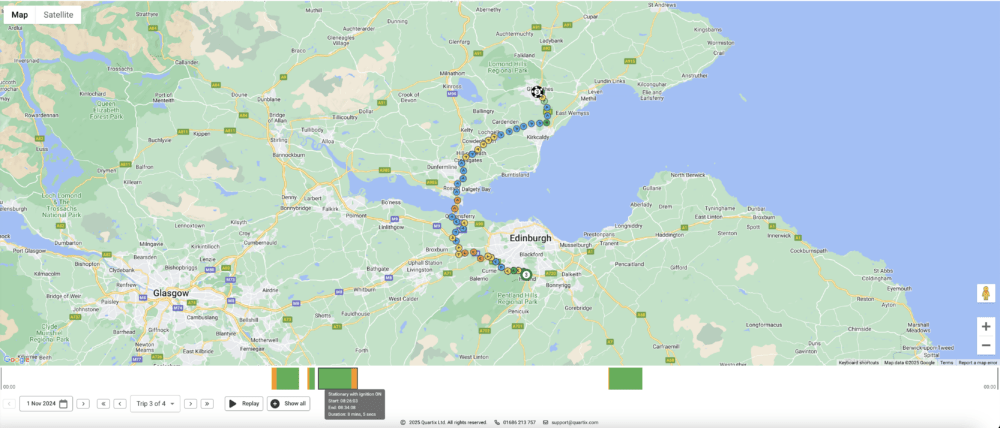
How to Access the Interactive Timeline
The new visual bar will show when selecting your vehicle journeys within Route Replay. You’ll immediately see a colour-coded band that segments a driver’s activity into three distinct categories:
- Green: Travel – Indicates periods when the vehicle is in motion.
- Yellow: Idle – Shows when the vehicle is stopped with the ignition on.
- White: Stop – Represents periods when the vehicle is stopped for a long period of time.
By simply hovering over a segment on the timeline, you can access detailed information about that specific part of the day.
Detailed Segment Insights
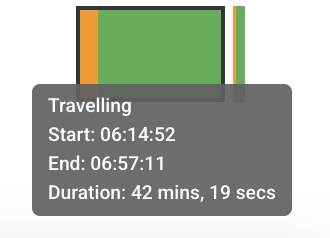
When you hover over a segment, a ‘detail box’ will appear with the following information:
- Event Type: Displays the type of activity, such as traveling, idling, or stopping.
- Time: Start and end time of the segment.
- Duration: Total time from start to finish, of the respective segment/event type.
Why This Matters
This new interactive timeline enhances the Route Replay feature by providing a complete picture of the entire journey. Previously, Route Replay used breadcrumbs to show the vehicle’s path, with colour-coded speed indicators—yellow for higher speeds and red for speeding. However, it didn’t display what happened between those points, such as whether the vehicle was idling.
Now, with this timeline, you get a full view of both route and activity, showing not just where the vehicle traveled, but also what it was doing at every stage—helping improve visibility.
Start Using the Interactive Timeline within Route Replay Today
The Interactive Timeline is live now inside route replay feature, ready to provide instant insights into your drivers’ day. It’s a powerful tool to help you stay on top of fleet activity, reduce downtime, and make informed decisions in real time.
Need to speak to one of our experts?


We’ll help you decide which vehicle tracking option is right for you